West Coast
Alaska • California • Oregon • Hawaii • Washington
East Coast
Connecticut • Delaware • Florida • Georgia • Maine • Maryland • Massachusetts • New Hampshire • New Jersey • New York • North Carolina • Pennsylvania • Rhode Island • South Carolina • Virginia • Washington D.C.
Gulf Coast
Alabama • Florida • Louisiana • Mississippi • Texas
Other
Puerto Rico • Pacific Islands
Tides FAQ
About Tides.net
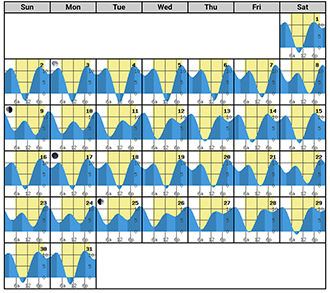
Tides.net delivers full-month printable tide charts and tables — navigable through 2030+, historical to 2021. Get clean, accurate, export-ready data. Built for planners, not just beachgoers:
- Coastal event organizers scheduling weddings & photo shoots
- Shellfish farmers timing harvest windows
- Ecologists monitoring tidal impacts and planning work
- Park services & hotels printing visitor schedules
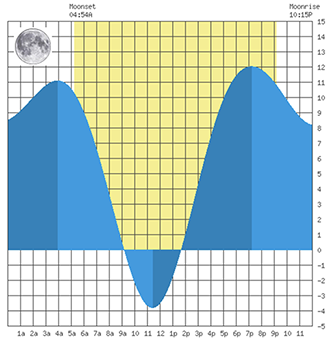
Yellow section = daylight hours. Tap any day on a calendar to see its full chart.
What Are Tides?
Tides are the regular rise and fall of sea levels, driven primarily by the gravitational pull of the Moon (and to a lesser extent the Sun) on Earth's oceans, combined with Earth's rotation.
The Moon's gravity pulls water toward it, forming a bulge on the near side. On the opposite side, centrifugal force from the Earth-Moon orbital motion creates a second bulge. As Earth rotates through these bulges, most coastal locations experience two high tides and two low tides per lunar day (about 24 hours 50 minutes).
Tide times shift later by roughly 50 minutes daily because the Moon orbits Earth, extending the lunar day beyond a standard solar day.
Tidal Patterns by Location
Geography and basin shape determine the pattern:
- Semidiurnal: Two nearly equal high and low tides daily (typical on U.S. East Coast).
- Diurnal: One high and one low tide daily (common in parts of the Gulf of Mexico).
- Mixed semidiurnal: Two high and two low tides daily, but unequal in height (common on U.S. West Coast).
Spring, Neap, and King Tides
Spring tides produce the largest tidal range when the Sun, Moon, and Earth align (new or full moon), reinforcing gravitational forces for higher highs and lower lows. ("Spring" refers to surging force, not the season.)
Neap tides have the smallest range, occurring when the Sun and Moon are at right angles (quarter moons), with forces partially canceling.
King tides are the year's most extreme tides—perigean spring tides when a spring tide aligns with the Moon at perigee (closest to Earth). This maximizes gravitational pull, causing exceptionally high highs and low lows. They preview future coastal flooding risks under sea-level rise (often without storms) and are more pronounced on the West Coast due to larger baseline ranges. On East/Gulf Coasts, they are generally less extreme but still significant in low-lying areas.
Tidal Currents
Tides also drive horizontal tidal currents:
- Flood current: Inland flow as the tide rises.
- Ebb current: Seaward flow as the tide falls.
- Slack tide: Brief period of minimal flow near high or low tide.
Currents are strongest midway between high and low tide and can be powerful (and dangerous) in narrow channels or inlets.
When Are King Tides?
King tides are the year's most extreme tides—perigean spring tides when a spring tide aligns with the Moon at perigee (closest to Earth). This maximizes gravitational pull, causing exceptionally high highs and low lows. They preview future coastal flooding risks under sea-level rise (often without storms) and are more pronounced on the West Coast due to larger baseline ranges. On East/Gulf Coasts, they are generally less extreme but still significant in low-lying areas.
King tides typically peak during winter months on the West Coast and fall/winter on East/Gulf Coasts, when perigean spring alignments are strongest. Exact dates and heights vary by location—always check local NOAA Tides & Currents predictions for your station.
West Coast (CA, OR, WA, HI, AK)
- 2025–2026: Nov 5–7 (2025), Dec 4–6 (2025), Jan 1–3 (2026)
- 2026–2027: Nov 30–Dec 2 (2026), Dec 29–31 (2026), Jan 27–29 (2027)
- 2027: Nov 25–27, Dec 24–26
East Coast & Gulf Coast (ME to TX)
- 2025–2026: Oct 10–12 (2025), Nov 7–9 (2025), Dec 6–8 (2025), Jan 3–5 (2026)
- 2026–2027: Nov 30–Dec 2 (2026), Dec 29–31 (2026), Jan 27–29 (2027)
- 2027: Nov 25–27, Dec 24–26
Note: The Gulf has smaller tidal ranges, so king tides are less dramatic but still increase flood risk.
How Are Tides Predicted?
Tides are predicted using harmonic analysis—breaking observed tides into mathematical components tied to astronomical cycles. This allows accurate forecasts years ahead, based purely on gravity (weather effects are not included).
Where Are the Highest Tides in the World?
The Bay of Fundy in Canada has the world's largest tidal range—up to 53 feet—due to its funnel shape amplifying the tide through resonance. Other extremes include Ungava Bay (Canada) and the Bristol Channel (UK).
When is the Best Time for Tidepooling?
The best tidepooling happens during minus tides (negative low tides), usually in spring and summer mornings. Look for tides below 0.0 ft on the West Coast or below –1.0 ft on the East Coast. The monthly calendar view on any station page highlights these with the darkest/lowest bars. Always check weather and never turn your back on the ocean.
Can I Print a Tide Chart Calendar for My Area?
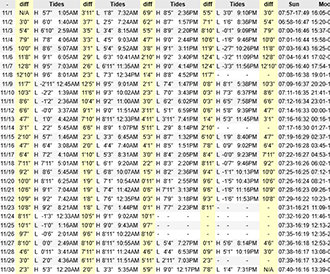
Yes — every station page has printable monthly and yearly tables under the Calendar tab. Guests view is limited so sign up for full access.
Why Don’t Tides Always Match Predictions?
Tide predictions are based only on astronomical forces. Real-world variations come from weather: storms, wind direction, barometric pressure, river runoff, and ocean currents can raise or lower water levels by a foot or more.
Data Sources and Credits
Tide predictions on Tides.net are computed using the open-source XTide harmonic tide prediction software (by David Flater) with official NOAA/NOS harmonic constants and station data.
All predictions are astronomical only — actual water levels may differ due to weather effects.
XTide home: https://flaterco.com/xtide/